
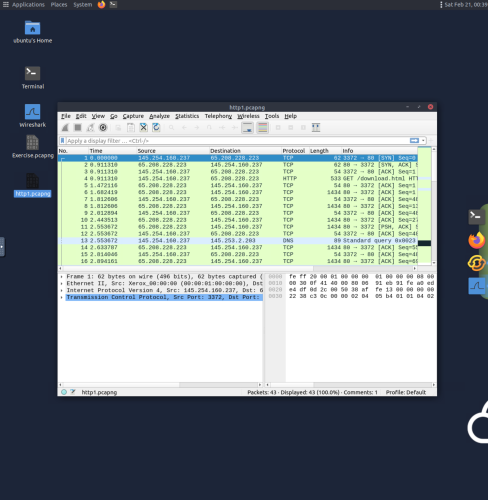
1. This example loads the “http1.pcap” capture file in Wireshark to view detailed network packet data.
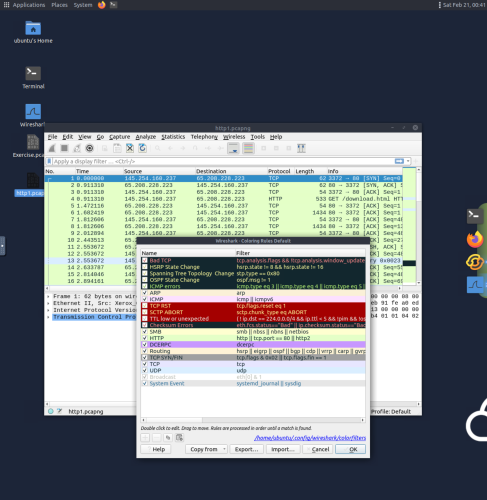
2. Selecting coloring rules under the view menu labels packets with different colors in order of different conditions and protocols. This information helps to track down specific packets during analysis.
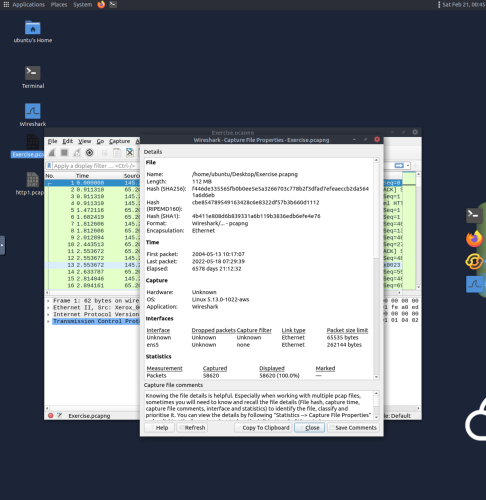
3. Selecting capture file properties under the statistics menu provides many useful file details such as file hash, capture time, capture file comments, interface and statistics.
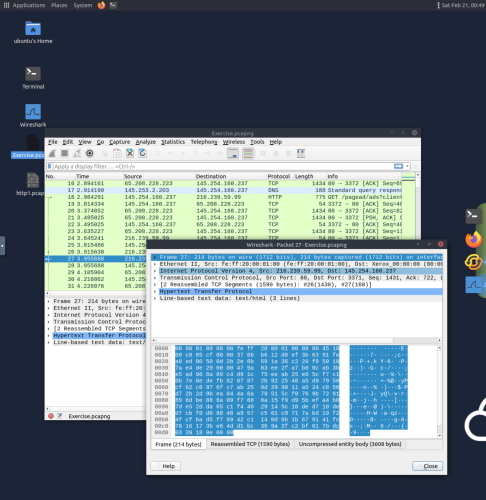
4. Double clicking on a packet in the packet list pane opens its packet details in a new window which displays several distinct layers; frame/packet, source [MAC], source [IP], protocol, protocol errors, application protocol, and application data.
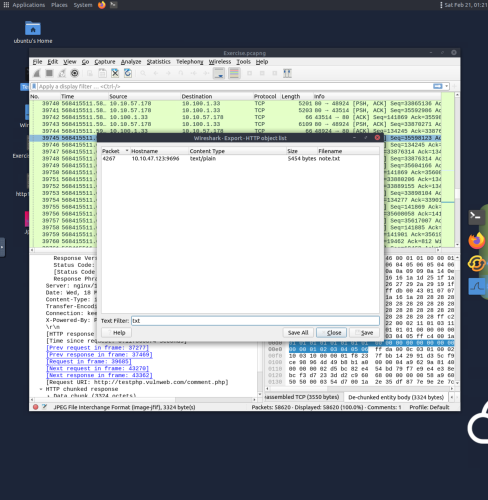
5. Navigating to file, export object, and http allows for text filtering. This example uses “txt” in the text filter section to check packets for txt files, and in this cast the packet 4267 contains the “note.txt” file.
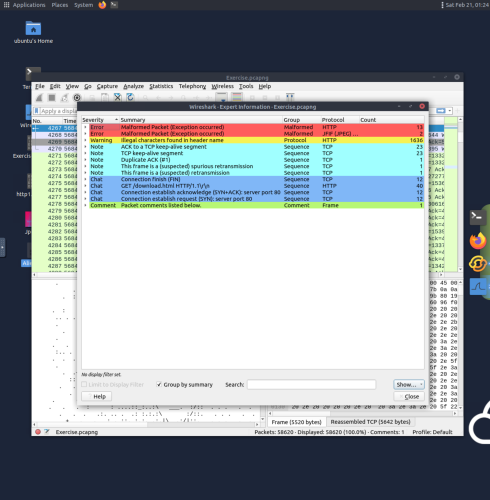
6. Clicking the circle icon in the lower left bottom section reveals expert information menu, which shows useful details such as packet number, summary, group protocol and total occurrence.
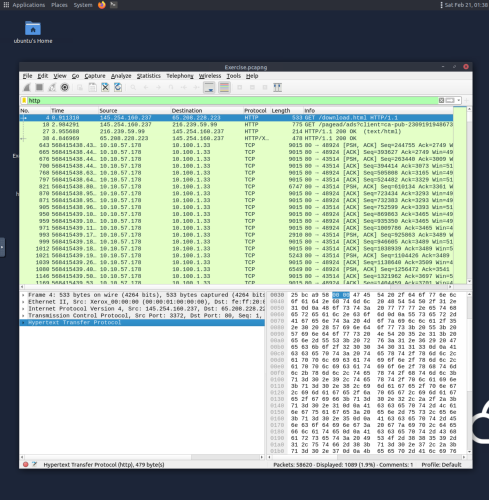
7. The display filter search bar allows packets to be filtered by type, and in this case packets are being filtered by http contents.
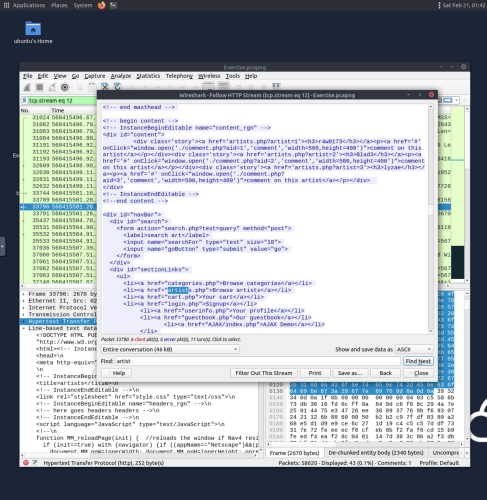
8. Right clicking a packet and selecting follow TCP/UDP/HTTP stream opens the follow stream dialogue box, which displays detailed application-level data about an event. Packets originating from the server are highlighted in blue, and packets from the client are highlighted in red.